Neither am I…
Each year I see reports on the highest paying entry level jobs and engineering disciplines are always near the top of the list. Early in my career I watched my salary grow significantly; however, now as an 18+ year veteran in the engineering field I’ve noticed that in the past 5 or 6 years my increases have tended to stagnate at or even below the cost of living. For several years now I have considered market fluctuations and political environments as potential causes for this apparent leveling off of my compensation. Over time this led me to wonder whether I had simply reached my peak for my particular profession and what the absolute maximum compensation was for top performers in my field might be.
To gain additional insight I consulted Salary.com‘s free salary reports. Salary.com uses employer-reported data comprised of 29 million individuals working at 16,000 companies adjusted for cost of living by zip code. The distribution of salaries is provided for various job titles for individuals with varying years of experience.
So I set off to determine what the absolute maximum salary might be for the various engineering disciplines.
Salary of Engineering Professionals with the Most Experience
The following table shows the salary distribution of Engineering professionals with the most experience. The 50, 75, and 90 percentile salaries are extracted from Salary.com‘s free salary reports for those individuals with greater than 8 years experience nationwide. The 99, 99.9, and 99.99 percentile salaries are interpolated from the data using curve fitting techniques (more on the methodology later) to provide the salary for the top 1% (1 in 100), 0.1% (1 in 1,000), and 0.01% (1 in 10,000). These last three data points provide a theoretical upper bound on the potential salaries of the various engineering disciplines. Although these salary results are numerically sound (in my humble opinion), these outlying salaries may or may not be achievable.
| Salary |
Percentile |
| Engineering Discipline |
50% |
75% |
90% |
99% |
99.90% |
99.99% |
| Aerospace |
$126,388 |
$139,715 |
$151,710 |
$172,354 |
$187,448 |
$199,872 |
| Chemical |
$130,711 |
$142,475 |
$153,064 |
$171,287 |
$184,611 |
$195,578 |
| Electrical |
$132,203 |
$144,736 |
$156,016 |
$175,429 |
$189,623 |
$201,306 |
| Field Services |
$109,043 |
$121,341 |
$132,410 |
$151,459 |
$165,387 |
$176,852 |
| Hardware |
$136,559 |
$151,212 |
$164,401 |
$187,099 |
$203,694 |
$217,355 |
| Industrial |
$118,650 |
$131,171 |
$142,439 |
$161,834 |
$176,014 |
$187,686 |
| Manufacturing |
$123,288 |
$136,221 |
$147,862 |
$167,896 |
$182,543 |
$194,600 |
| Materials |
$124,736 |
$148,896 |
$170,640 |
$208,063 |
$235,425 |
$257,947 |
| Mechanical |
$131,221 |
$142,349 |
$152,365 |
$169,603 |
$182,207 |
$192,581 |
| Network |
$118,593 |
$131,441 |
$143,004 |
$162,905 |
$177,456 |
$189,433 |
| Production |
$110,630 |
$122,780 |
$133,716 |
$152,537 |
$166,297 |
$177,624 |
| Quality Assurance |
$127,766 |
$138,309 |
$147,798 |
$164,129 |
$176,069 |
$185,898 |
| Reliability |
$118,354 |
$129,377 |
$139,298 |
$156,374 |
$168,858 |
$179,134 |
| Software |
$127,740 |
$141,481 |
$153,849 |
$175,135 |
$190,697 |
$203,508 |
| Systems |
$132,113 |
$147,033 |
$160,461 |
$156,374 |
$200,469 |
$214,378 |
| Telecommunications |
$112,571 |
$124,151 |
$134,574 |
$152,512 |
$165,627 |
$176,423 |
| Test |
$118,517 |
$127,561 |
$135,701 |
$149,711 |
$159,954 |
$168,385 |
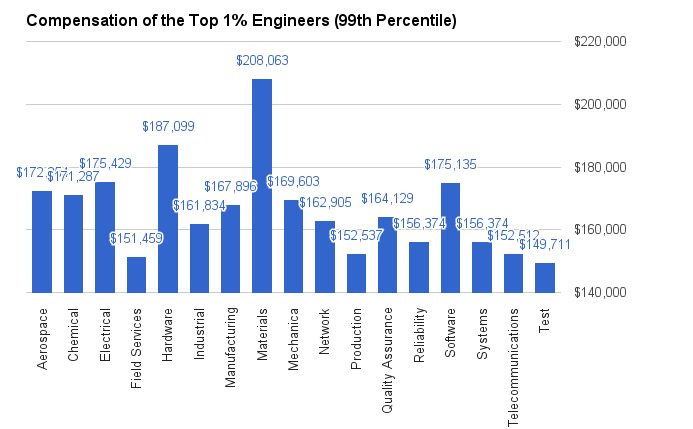
Below is more detail into the salary data for each discipline as well as the methodology used to interpolate data.
Before you leave don’t forget to:
- Subscribe to the blog in the right side panel
- Share this article with your friends!
- Leave a comment
Aerospace Engineering Salary
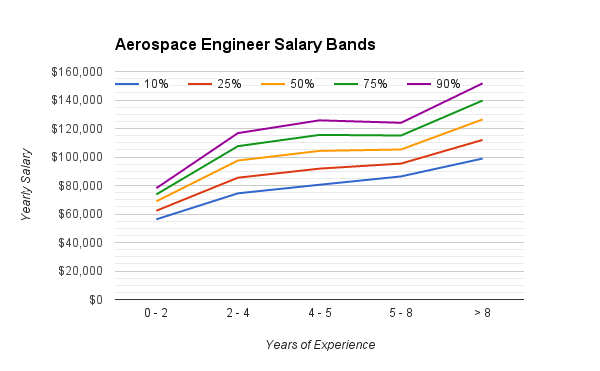
Below is the Salary.com salary data for Aerospace Engineers. The available salary percentile data has been plotted for individuals with varying levels of experience.
| Aerospace Engineer |
Percentile |
|
| Experience (yrs) |
10% |
25% |
50% |
75% |
90% |
Source |
| 0 – 2 |
$56,244 |
$62,275 |
$68,899 |
$73,710 |
$78,090 |
http://swz.salary.com/SalaryWizard/Aerospace-Engineer-I-Salary-Details.aspx |
| 2 – 4 |
$74,503 |
$85,474 |
$97,523 |
$107,592 |
$116,759 |
http://swz.salary.com/SalaryWizard/Aerospace-Engineer-II-Salary-Details.aspx |
| 4 – 5 |
$80,517 |
$91,841 |
$104,280 |
$115,509 |
$125,732 |
http://swz.salary.com/SalaryWizard/Aerospace-Engineer-III-Salary-Details.aspx |
| 5 – 8 |
$86,376 |
$95,383 |
$105,276 |
$115,077 |
$124,001 |
http://swz.salary.com/SalaryWizard/Aerospace-Engineer-IV-Salary-Details.aspx |
| > 8 |
$98,921 |
$112,011 |
$126,388 |
$139,642 |
$151,710 |
http://swz.salary.com/SalaryWizard/Aerospace-Engineer-V-Salary-Details.aspx |
Aerospace Engineering Salary (for Experienced Top Performers)
The following data is representative of the interpolation that went into determining the 99, 99.9, and 99.99 percentile salaries. Using the 50th percentile salary reported by Salary.com as the mean and assuming a normal distribution, the standard deviation of the data was determined (to the nearest dollar) as the value that resulted in the smallest delta between the data reported by Salary.com (“Actual”) and the sampled standard deviation (“Projected”).
| mean |
$126,388 |
|
|
| stddev |
$19,759 |
|
|
|
|
|
|
| Percentile |
Actual |
Projected |
Delta |
| 75% |
$139,642 |
$139,715 |
73.24 |
| 90% |
$151,710 |
$151,710 |
0.18 |
| 99% |
NA |
$172,354 |
NA |
| 99.9% |
NA |
$187,448 |
NA |
| 99.99% |
NA |
$199,872 |
NA |
Chemical Engineering Salary
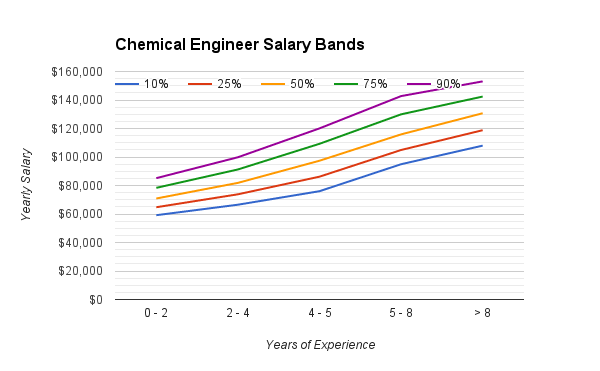
Below is the
Salary.com salary data for Chemical Engineers. The available salary percentile data has been plotted for individuals with varying levels of experience.
| Chemical Engineer |
Percentile |
|
| Experience (yrs) |
10% |
25% |
50% |
75% |
90% |
Source |
| 0 – 2 |
$59,162 |
$64,746 |
$70,880 |
$78,348 |
$85,148 |
http://swz.salary.com/SalaryWizard/Chemical-Engineer-I-Salary-Details.aspx |
| 2 – 4 |
$66,517 |
$73,819 |
$81,839 |
$91,249 |
$99,817 |
http://swz.salary.com/SalaryWizard/Chemical-Engineer-II-Salary-Details.aspx |
| 4 – 5 |
$76,001 |
$86,189 |
$97,380 |
$109,262 |
$120,080 |
http://swz.salary.com/SalaryWizard/Chemical-Engineer-III-Salary-Details.aspx |
| 5 – 8 |
$94,930 |
$104,913 |
$115,877 |
$129,941 |
$142,746 |
http://swz.salary.com/SalaryWizard/Chemical-Engineer-IV-Salary-Details.aspx |
| > 8 |
$107,973 |
$118,809 |
$130,711 |
$142,412 |
$153,064 |
http://swz.salary.com/SalaryWizard/Chemical-Engineer-V-Salary-Details.aspx |
Chemical Engineering Salary (for Experienced Top Performers)
The following data is representative of the interpolation that went into determining the 99, 99.9, and 99.99 percentile salaries. Using the 50th percentile salary reported by
Salary.com as the mean and assuming a normal distribution, the standard deviation of the data was determined (to the nearest dollar) as the value that resulted in the smallest delta between the data reported by
Salary.com (“Actual”) and the sampled standard deviation (“Projected”).
| mean |
$130,711 |
|
|
| stddev |
$17,442 |
|
|
|
|
|
|
| Percentile |
Actual |
Projected |
Delta |
| 75% |
$142,412 |
$142,475 |
63.45 |
| 90% |
$153,064 |
$153,064 |
0.18 |
| 99% |
NA |
$171,287 |
NA |
| 99.9% |
NA |
$184,611 |
NA |
| 99.99% |
NA |
$195,578 |
NA |
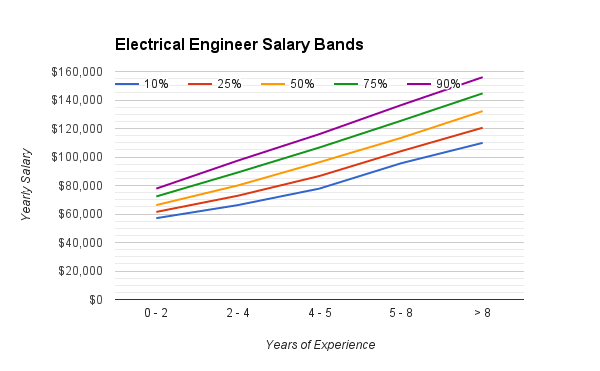
Electrical Engineering Salary
Below is the
Salary.com salary data for Electrical Engineers. The available salary percentile data has been plotted for individuals with varying levels of experience.
| Electrical Engineer |
Percentile |
|
| Experience (yrs) |
10% |
25% |
50% |
75% |
90% |
Source |
| 0 – 2 |
$57,076 |
$61,448 |
$66,251 |
$72,300 |
$77,807 |
http://swz.salary.com/SalaryWizard/Electrical-Engineer-I-Salary-Details-Location.aspx |
| 2 – 4 |
$66,246 |
$72,822 |
$80,045 |
$89,169 |
$97,477 |
http://swz.salary.com/SalaryWizard/Electrical-Engineer-II-Salary-Details-Location.aspx |
| 4 – 5 |
$77,843 |
$86,669 |
$96,363 |
$106,680 |
$116,073 |
http://swz.salary.com/SalaryWizard/Electrical-Engineer-III-Salary-Details-Location.aspx |
| 5 – 8 |
$95,606 |
$104,092 |
$113,412 |
$125,447 |
$136,404 |
http://swz.salary.com/SalaryWizard/Electrical-Engineer-IV-Salary-Details-Location.aspx |
| > 8 |
$109,938 |
$120,549 |
$132,203 |
$144,668 |
$156,017 |
http://swz.salary.com/SalaryWizard/Electrical-Engineer-V-Salary-Details-Location.aspx |
Electrical Engineering Salary (for Experienced Top Performers)
The following data is representative of the interpolation that went into determining the 99, 99.9, and 99.99 percentile salaries. Using the 50th percentile salary reported by
Salary.com as the mean and assuming a normal distribution, the standard deviation of the data was determined (to the nearest dollar) as the value that resulted in the smallest delta between the data reported by
Salary.com (“Actual”) and the sampled standard deviation (“Projected”).
| mean |
$132,203 |
|
|
| stddev |
$18,581 |
|
|
|
|
|
|
| Percentile |
Actual |
Projected |
Delta |
| 75% |
$144,668 |
$144,736 |
67.69 |
| 90% |
$156,017 |
$156,016 |
1.49 |
| 99% |
NA |
$175,429 |
NA |
| 99.9% |
NA |
$189,623 |
NA |
| 99.99% |
NA |
$201,306 |
NA |
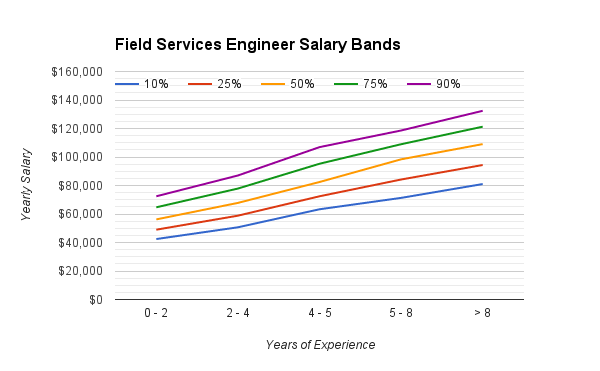
Field Serivices Engineering Salary
Below is the
Salary.com salary data for Field Engineers. The available salary percentile data has been plotted for individuals with varying levels of experience.
| Field Services Engineer |
Percentile |
|
| Experience (yrs) |
10% |
25% |
50% |
75% |
90% |
Source |
| 0 – 2 |
$42,423 |
$48,988 |
$56,200 |
$64,692 |
$72,424 |
http://swz.salary.com/SalaryWizard/Field-Service-Engineer-I-Salary-Details.aspx |
| 2 – 4 |
$50,662 |
$58,821 |
$67,783 |
$77,852 |
$87,019 |
http://swz.salary.com/SalaryWizard/Field-Service-Engineer-II-Salary-Details.aspx |
| 4 – 5 |
$63,315 |
$72,431 |
$82,444 |
$95,257 |
$106,923 |
http://swz.salary.com/SalaryWizard/Field-Service-Engineer-III-Salary-Details.aspx |
| 5 – 8 |
$71,303 |
$84,199 |
$98,365 |
$108,954 |
$118,596 |
http://swz.salary.com/SalaryWizard/Field-Service-Engineer-IV-Salary-Details.aspx |
| > 8 |
$81,025 |
$94,378 |
$109,043 |
$121,275 |
$132,411 |
http://swz.salary.com/SalaryWizard/Field-Service-Engineer-V-Salary-Details.aspx |
Field Services Engineering Salary (for Experienced Top Performers)
The following data is representative of the interpolation that went into determining the 99, 99.9, and 99.99 percentile salaries. Using the 50th percentile salary reported by
Salary.com as the mean and assuming a normal distribution, the standard deviation of the data was determined (to the nearest dollar) as the value that resulted in the smallest delta between the data reported by
Salary.com (“Actual”) and the sampled standard deviation (“Projected”).
| mean |
$109,043 |
|
|
| stddev |
$18,233 |
|
|
|
|
|
|
| Percentile |
Actual |
Projected |
Delta |
| 75% |
$121,275 |
$121,341 |
65.97 |
| 90% |
$132,411 |
$132,410 |
1.47 |
| 99% |
NA |
$151,459 |
NA |
| 99.9% |
NA |
$165,387 |
NA |
| 99.99% |
NA |
$176,852 |
NA |
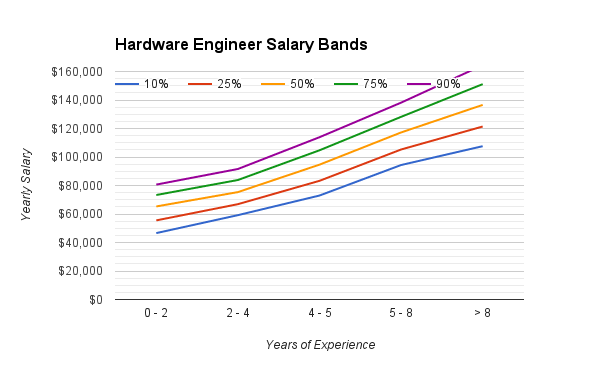
Hardware Engineering Salary
Below is the
Salary.com salary data for Hardware Engineers. The available salary percentile data has been plotted for individuals with varying levels of experience.
| Hardware Engineer |
Percentile |
|
| Experience (yrs) |
10% |
25% |
50% |
75% |
90% |
Source |
| 0 – 2 |
$46,597 |
$55,508 |
$65,296 |
$73,325 |
$80,636 |
http://swz.salary.com/SalaryWizard/Hardware-Engineer-I-Salary-Details.aspx |
| 2 – 4 |
$59,186 |
$66,895 |
$75,362 |
$83,850 |
$91,577 |
http://swz.salary.com/SalaryWizard/Hardware-Engineer-II-Salary-Details.aspx |
| 4 – 5 |
$72,954 |
$83,280 |
$94,622 |
$104,706 |
$113,886 |
http://swz.salary.com/SalaryWizard/Hardware-Engineer-III-Salary-Details.aspx |
| 5 – 8 |
$94,366 |
$105,262 |
$117,230 |
$128,177 |
$138,144 |
http://swz.salary.com/SalaryWizard/Hardware-Engineer-IV-Salary-Details.aspx |
| > 8 |
$107,585 |
$121,393 |
$136,559 |
$151,134 |
$164,405 |
http://swz.salary.com/SalaryWizard/Hardware-Engineer-V-Salary-Details.aspx |
Hardware Engineering Salary (for Experienced Top Performers)
The following data is representative of the interpolation that went into determining the 99, 99.9, and 99.99 percentile salaries. Using the 50th percentile salary reported by
Salary.com as the mean and assuming a normal distribution, the standard deviation of the data was determined (to the nearest dollar) as the value that resulted in the smallest delta between the data reported by
Salary.com (“Actual”) and the sampled standard deviation (“Projected”).
| mean |
$136,559 |
|
|
| stddev |
$21,725 |
|
|
|
|
|
|
| Percentile |
Actual |
Projected |
Delta |
| 75% |
$151,134 |
$151,212 |
78.29 |
| 90% |
$164,405 |
$164,401 |
4.29 |
| 99% |
NA |
$187,099 |
NA |
| 99.9% |
NA |
$203,694 |
NA |
| 99.99% |
NA |
$217,355 |
NA |
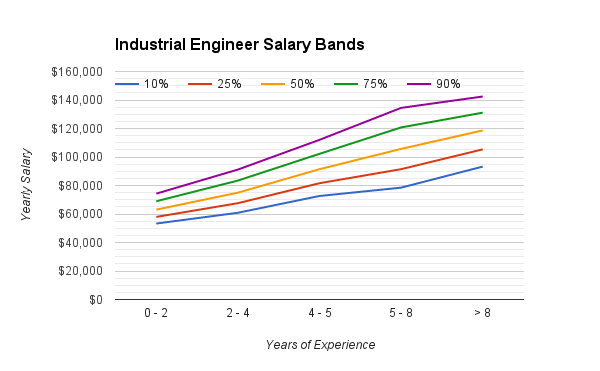
Industrial Engineering Salary
Below is the
Salary.com salary data for Industrial Engineers. The available salary percentile data has been plotted for individuals with varying levels of experience.
| Industrial Engineer |
Percentile |
|
| Experience (yrs) |
10% |
25% |
50% |
75% |
90% |
Source |
| 0 – 2 |
$53,302 |
$57,959 |
$63,074 |
$68,945 |
$74,290 |
http://swz.salary.com/SalaryWizard/Industrial-Engineer-I-Salary-Details.aspx |
| 2 – 4 |
$60,862 |
$67,585 |
$74,968 |
$83,453 |
$91,179 |
http://swz.salary.com/SalaryWizard/Industrial-Engineer-II-Salary-Details.aspx |
| 4 – 5 |
$72,645 |
$81,608 |
$91,452 |
$102,229 |
$112,042 |
http://swz.salary.com/SalaryWizard/Industrial-Engineer-III-Salary-Details.aspx |
| 5 – 8 |
$78,480 |
$91,449 |
$105,694 |
$120,753 |
$134,464 |
http://swz.salary.com/SalaryWizard/Industrial-Engineer-IV-Salary-Details.aspx |
| > 8 |
$93,263 |
$105,361 |
$118,650 |
$131,103 |
$142,441 |
http://swz.salary.com/SalaryWizard/Industrial-Engineer-V-Salary-Details.aspx |
Industrial Engineering Salary (for Experienced Top Performers)
The following data is representative of the interpolation that went into determining the 99, 99.9, and 99.99 percentile salaries. Using the 50th percentile salary reported by
Salary.com as the mean and assuming a normal distribution, the standard deviation of the data was determined (to the nearest dollar) as the value that resulted in the smallest delta between the data reported by
Salary.com (“Actual”) and the sampled standard deviation (“Projected”).
| mean |
$118,650 |
|
|
| stddev |
$18,563 |
|
|
|
|
|
|
| Percentile |
Actual |
Projected |
Delta |
| 75% |
$131,103 |
$131,171 |
67.55 |
| 90% |
$142,441 |
$142,439 |
1.56 |
| 99% |
NA |
$161,834 |
NA |
| 99.9% |
NA |
$176,014 |
NA |
| 99.99% |
NA |
$187,686 |
NA |
Manufacturing Engineering Salary
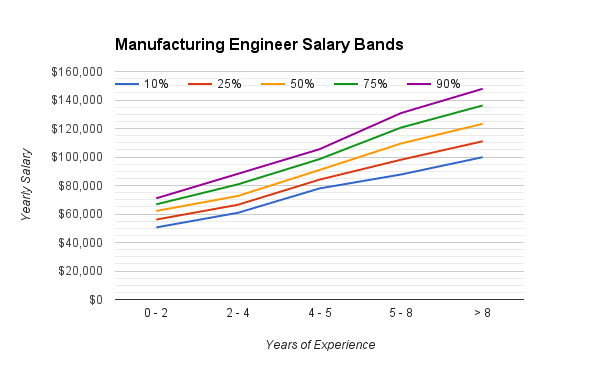
Below is the
Salary.com salary data for Manufacturing Engineers. The available salary percentile data has been plotted for individuals with varying levels of experience.
| Manufacturing Engineer |
Percentile |
|
| Experience (yrs) |
10% |
25% |
50% |
75% |
90% |
Source |
| 0 – 2 |
$50,590 |
$56,088 |
$62,127 |
$66,781 |
$71,018 |
http://swz.salary.com/SalaryWizard/Manufacturing-Engineer-I-Salary-Details-Location.aspx |
| 2 – 4 |
$60,839 |
$66,469 |
$72,653 |
$80,793 |
$88,203 |
http://swz.salary.com/SalaryWizard/Manufacturing-Engineer-II-Salary-Details-Location.aspx |
| 4 – 5 |
$77,935 |
$84,101 |
$90,872 |
$98,506 |
$105,456 |
http://swz.salary.com/SalaryWizard/Manufacturing-Engineer-III-Salary-Details-Location.aspx |
| 5 – 8 |
$87,727 |
$98,088 |
$109,467 |
$120,655 |
$130,842 |
http://swz.salary.com/SalaryWizard/Manufacturing-Engineer-IV-Salary-Details-Location.aspx |
| > 8 |
$99,880 |
$111,035 |
$123,288 |
$136,151 |
$147,863 |
http://swz.salary.com/SalaryWizard/Manufacturing-Engineer-V-Salary-Details-Location.aspx |
Manufacturing Engineering Salary (for Experienced Top Performers)
The following data is representative of the interpolation that went into determining the 99, 99.9, and 99.99 percentile salaries. Using the 50th percentile salary reported by
Salary.com as the mean and assuming a normal distribution, the standard deviation of the data was determined (to the nearest dollar) as the value that resulted in the smallest delta between the data reported by
Salary.com (“Actual”) and the sampled standard deviation (“Projected”).
| mean |
$123,288 |
|
|
| stddev |
$19,175 |
|
|
|
|
|
|
| Percentile |
Actual |
Projected |
Delta |
| 75% |
$136,151 |
$136,221 |
70.34 |
| 90% |
$147,863 |
$147,862 |
1.25 |
| 99% |
NA |
$167,896 |
NA |
| 99.9% |
NA |
$182,543 |
NA |
| 99.99% |
NA |
$194,600 |
NA |
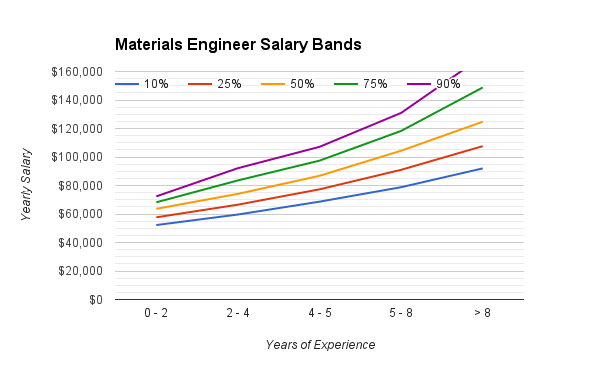
Materials Engineering Salary
Below is the
Salary.com salary data for Materials Engineers. The available salary percentile data has been plotted for individuals with varying levels of experience.
| Materials Engineer |
Percentile |
|
| Experience (yrs) |
10% |
25% |
50% |
75% |
90% |
Source |
| 0 – 2 |
$52,248 |
$57,671 |
$63,626 |
$68,198 |
$72,361 |
http://swz.salary.com/SalaryWizard/Materials-Engineer-I-Salary-Details.aspx |
| 2 – 4 |
$59,628 |
$66,540 |
$74,132 |
$83,561 |
$92,145 |
http://swz.salary.com/SalaryWizard/Materials-Engineer-II-Salary-Details.aspx |
| 4 – 5 |
$68,653 |
$77,299 |
$86,795 |
$97,437 |
$107,126 |
http://swz.salary.com/SalaryWizard/Materials-Engineer-III-Salary-Details.aspx |
| 5 – 8 |
$78,801 |
$91,000 |
$104,399 |
$118,285 |
$130,928 |
http://swz.salary.com/SalaryWizard/Materials-Engineer-IV-Salary-Details.aspx |
| > 8 |
$92,001 |
$107,601 |
$124,736 |
$148,764 |
$170,641 |
http://swz.salary.com/SalaryWizard/Materials-Engineer-V-Salary-Details.aspx |
Materials Engineering Salary (for Experienced Top Performers)
The following data is representative of the interpolation that went into determining the 99, 99.9, and 99.99 percentile salaries. Using the 50th percentile salary reported by
Salary.com as the mean and assuming a normal distribution, the standard deviation of the data was determined (to the nearest dollar) as the value that resulted in the smallest delta between the data reported by
Salary.com (“Actual”) and the sampled standard deviation (“Projected”).
| mean |
$124,736 |
|
|
| stddev |
$35,819 |
|
|
|
|
|
|
| Percentile |
Actual |
Projected |
Delta |
| 75% |
$148,764 |
$148,896 |
131.55 |
| 90% |
$170,641 |
$170,640 |
1.10 |
| 99% |
NA |
$208,063 |
NA |
| 99.9% |
NA |
$235,425 |
NA |
| 99.99% |
NA |
$257,947 |
NA |
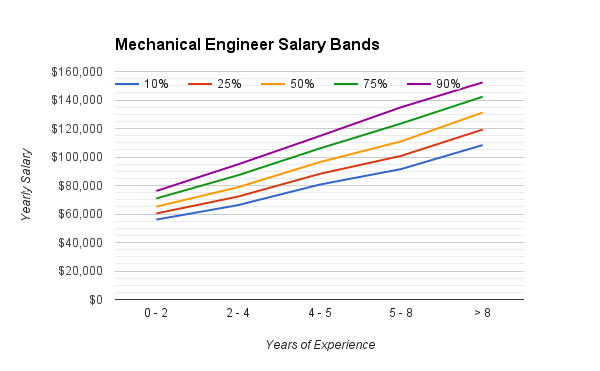
Mechanical Engineering Salary
Below is the
Salary.com salary data for Mechanical Engineers. The available salary percentile data has been plotted for individuals with varying levels of experience.
| Mechanical Engineer |
Percentile |
|
| Experience (yrs) |
10% |
25% |
50% |
75% |
90% |
Source |
| 0 – 2 |
$56,059 |
$60,391 |
$65,149 |
$70,903 |
$76,142 |
http://swz.salary.com/SalaryWizard/Mechanical-Engineer-I-Salary-Details-Location.aspx |
| 2 – 4 |
$66,200 |
$72,186 |
$78,760 |
$87,154 |
$94,797 |
http://swz.salary.com/SalaryWizard/Mechanical-Engineer-II-Salary-Details-Location.aspx |
| 4 – 5 |
$80,611 |
$88,114 |
$96,355 |
$105,938 |
$114,663 |
http://swz.salary.com/SalaryWizard/Mechanical-Engineer-III-Salary-Details-Location.aspx |
| 5 – 8 |
$91,522 |
$100,785 |
$110,959 |
$123,504 |
$134,925 |
http://swz.salary.com/SalaryWizard/Mechanical-Engineer-IV-Salary-Details-Location.aspx |
| > 8 |
$108,361 |
$119,255 |
$131,221 |
$142,289 |
$152,366 |
http://swz.salary.com/SalaryWizard/Mechanical-Engineer-V-Salary-Details-Location.aspx |
Mechanical Engineering Salary (for Experienced Top Performers)
The following data is representative of the interpolation that went into determining the 99, 99.9, and 99.99 percentile salaries. Using the 50th percentile salary reported by
Salary.com as the mean and assuming a normal distribution, the standard deviation of the data was determined (to the nearest dollar) as the value that resulted in the smallest delta between the data reported by
Salary.com (“Actual”) and the sampled standard deviation (“Projected”).
| mean |
$131,221 |
|
|
| stddev |
$16,499 |
|
|
|
|
|
|
| Percentile |
Actual |
Projected |
Delta |
| 75% |
$142,289 |
$142,349 |
60.41 |
| 90% |
$152,366 |
$152,365 |
0.68 |
| 99% |
NA |
$169,603 |
NA |
| 99.9% |
NA |
$182,207 |
NA |
| 99.99% |
NA |
$192,581 |
NA |
Network Engineering Salary
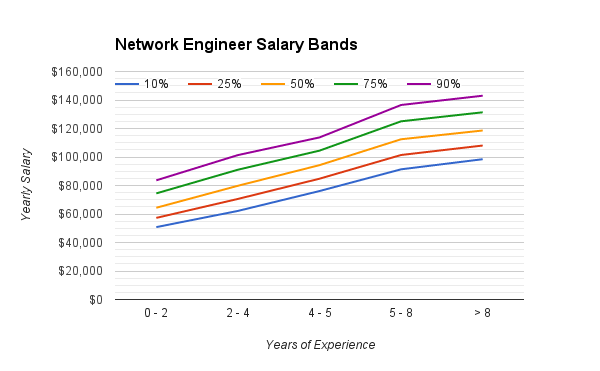
Below is the Salary.com salary data for Network Engineers. The available salary percentile data has been plotted for individuals with varying levels of experience.
| Network Engineer |
Percentile |
|
| Experience (yrs) |
10% |
25% |
50% |
75% |
90% |
Source |
| 0 – 2 |
$50,794 |
$57,271 |
$64,385 |
$74,458 |
$83,630 |
http://swz.salary.com/SalaryWizard/Network-Engineer-I-Salary-Details.aspx |
| 2 – 4 |
$62,157 |
$70,565 |
$79,801 |
$91,074 |
$101,339 |
http://swz.salary.com/SalaryWizard/Network-Engineer-II-Salary-Details.aspx |
| 4 – 5 |
$76,108 |
$84,765 |
$94,275 |
$104,459 |
$113,731 |
http://swz.salary.com/SalaryWizard/Network-Engineer-III-Salary-Details.aspx |
| 5 – 8 |
$91,355 |
$101,407 |
$112,447 |
$125,039 |
$136,502 |
http://swz.salary.com/SalaryWizard/Network-Engineer-IV-Salary-Details.aspx |
| > 8 |
$98,446 |
$108,047 |
$118,593 |
$131,371 |
$143,004 |
http://swz.salary.com/SalaryWizard/Network-Engineer-V-Salary-Details.aspx |
Network Engineering Salary (for Experienced Top Performers)
The following data is representative of the interpolation that went into determining the 99, 99.9, and 99.99 percentile salaries. Using the 50th percentile salary reported by
Salary.com as the mean and assuming a normal distribution, the standard deviation of the data was determined (to the nearest dollar) as the value that resulted in the smallest delta between the data reported by
Salary.com (“Actual”) and the sampled standard deviation (“Projected”).
| mean |
$118,593 |
|
|
| stddev |
$19,048 |
|
|
|
|
|
|
| Percentile |
Actual |
Projected |
Delta |
| 75% |
$131,371 |
$131,441 |
69.68 |
| 90% |
$143,004 |
$143,004 |
0.01 |
| 99% |
NA |
$162,905 |
NA |
| 99.9% |
NA |
$177,456 |
NA |
| 99.99% |
NA |
$189,433 |
NA |
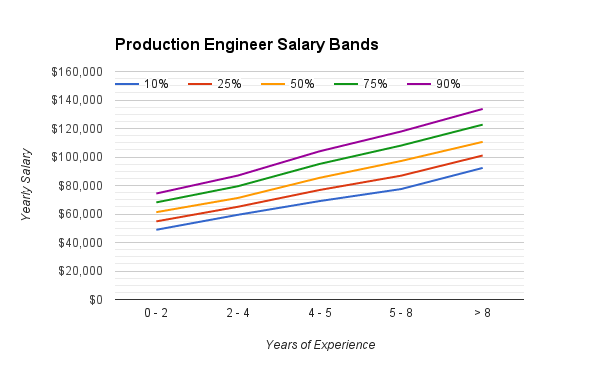
Production Engineering Salary
Below is the
Salary.com salary data for Production Engineers. The available salary percentile data has been plotted for individuals with varying levels of experience.
| Production Engineer |
Percentile |
|
| Experience (yrs) |
10% |
25% |
50% |
75% |
90% |
Source |
| 0 – 2 |
$48,922 |
$54,813 |
$61,282 |
$68,140 |
$74,383 |
http://swz.salary.com/SalaryWizard/Production-Engineer-I-Salary-Details.aspx |
| 2 – 4 |
$59,435 |
$65,068 |
$71,254 |
$79,486 |
$86,980 |
http://swz.salary.com/SalaryWizard/Production-Engineer-II-Salary-Details.aspx |
| 4 – 5 |
$69,056 |
$76,828 |
$85,366 |
$95,112 |
$103,986 |
http://swz.salary.com/SalaryWizard/Production-Engineer-III-Salary-Details.aspx |
| 5 – 8 |
$77,499 |
$86,887 |
$97,200 |
$108,032 |
$117,894 |
http://swz.salary.com/SalaryWizard/Production-Engineer-IV-Salary-Details.aspx |
| > 8 |
$92,332 |
$101,052 |
$110,630 |
$122,713 |
$133,715 |
http://swz.salary.com/SalaryWizard/Production-Engineer-V-Salary-Details.aspx |
Production Engineering Salary (for Experienced Top Performers)
The following data is representative of the interpolation that went into determining the 99, 99.9, and 99.99 percentile salaries. Using the 50th percentile salary reported by
Salary.com as the mean and assuming a normal distribution, the standard deviation of the data was determined (to the nearest dollar) as the value that resulted in the smallest delta between the data reported by
Salary.com (“Actual”) and the sampled standard deviation (“Projected”).
| mean |
$110,630 |
|
|
| stddev |
$18,014 |
|
|
|
|
|
|
| Percentile |
Actual |
Projected |
Delta |
| 75% |
$122,713 |
$122,780 |
67.26 |
| 90% |
$133,715 |
$133,716 |
0.87 |
| 99% |
NA |
$152,537 |
NA |
| 99.9% |
NA |
$166,297 |
NA |
| 99.99% |
NA |
$177,624 |
NA |
Quality Assurance Engineering Salary
Below is the Salary.com salary data for Quality Assurance Engineers. The available salary percentile data has been plotted for individuals with varying levels of experience.
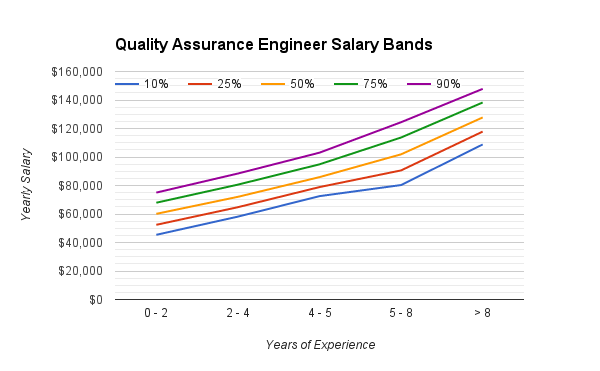
| Quality Assurance Engineer |
Percentile |
|
| Experience (yrs) |
10% |
25% |
50% |
75% |
90% |
Source |
| 0 – 2 |
$45,391 |
$52,405 |
$60,109 |
$67,913 |
$75,018 |
http://swz.salary.com/SalaryWizard/Quality-Assurance-Engineer-I-Salary-Details.aspx |
| 2 – 4 |
$58,151 |
$64,775 |
$72,050 |
$80,606 |
$88,396 |
http://swz.salary.com/SalaryWizard/Quality-Assurance-Engineer-II-Salary-Details.aspx |
| 4 – 5 |
$72,528 |
$78,887 |
$85,871 |
$94,856 |
$103,037 |
http://swz.salary.com/SalaryWizard/Quality-Assurance-Engineer-III-Salary-Details.aspx |
| 5 – 8 |
$80,317 |
$90,594 |
$101,882 |
$113,678 |
$124,418 |
http://swz.salary.com/SalaryWizard/Quality-Assurance-Engineer-IV-Salary-Details.aspx |
| > 8 |
$108,796 |
$117,836 |
$127,766 |
$138,251 |
$147,798 |
http://swz.salary.com/SalaryWizard/Quality-Assurance-Engineer-V-Salary-Details.aspx |
Quality Assurance Engineering Salary (for Experienced Top Performers)
The following data is representative of the interpolation that went into determining the 99, 99.9, and 99.99 percentile salaries. Using the 50th percentile salary reported by
Salary.com as the mean and assuming a normal distribution, the standard deviation of the data was determined (to the nearest dollar) as the value that resulted in the smallest delta between the data reported by
Salary.com (“Actual”) and the sampled standard deviation (“Projected”).
| mean |
$127,766 |
|
|
| stddev |
$15,631 |
|
|
|
|
|
|
| Percentile |
Actual |
Projected |
Delta |
| 75% |
$138,251 |
$138,309 |
57.95 |
| 90% |
$147,798 |
$147,798 |
0.07 |
| 99% |
NA |
$164,129 |
NA |
| 99.9% |
NA |
$176,069 |
NA |
| 99.99% |
NA |
$185,898 |
NA |
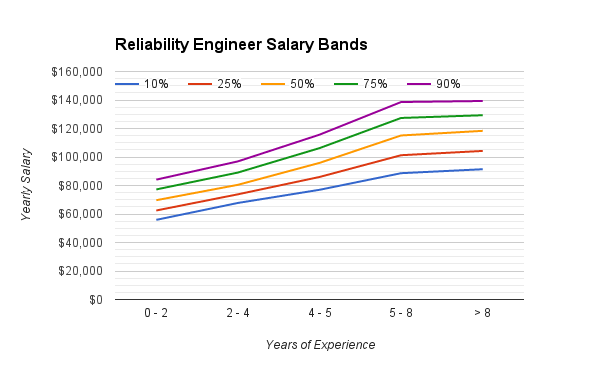
Reliability Engineering Salary
Below is the
Salary.com salary data for Reliability Engineers. The available salary percentile data has been plotted for individuals with varying levels of experience.
| Reliability Engineer |
Percentile |
|
| Experience (yrs) |
10% |
25% |
50% |
75% |
90% |
Source |
| 0 – 2 |
$55,890 |
$62,464 |
$69,685 |
$77,235 |
$84,109 |
http://swz.salary.com/SalaryWizard/Reliability-Engineer-I-Salary-Details-Location.aspx |
| 2 – 4 |
$67,749 |
$73,813 |
$80,474 |
$89,082 |
$96,920 |
http://swz.salary.com/SalaryWizard/Reliability-Engineer-II-Salary-Details-Location.aspx |
| 4 – 5 |
$76,979 |
$85,977 |
$95,861 |
$106,220 |
$115,652 |
http://swz.salary.com/SalaryWizard/Reliability-Engineer-III-Salary-Details-Location.aspx |
| 5 – 8 |
$88,635 |
$101,250 |
$115,107 |
$127,394 |
$138,581 |
http://swz.salary.com/SalaryWizard/Reliability-Engineer-IV-Salary-Details-Location.aspx |
| > 8 |
$91,421 |
$104,256 |
$118,354 |
$129,317 |
$139,299 |
http://swz.salary.com/SalaryWizard/Reliability-Engineer-V-Salary-Details-Location.aspx |
Reliability Engineering Salary (for Experienced Top Performers)
The following data is representative of the interpolation that went into determining the 99, 99.9, and 99.99 percentile salaries. Using the 50th percentile salary reported by
Salary.com as the mean and assuming a normal distribution, the standard deviation of the data was determined (to the nearest dollar) as the value that resulted in the smallest delta between the data reported by
Salary.com (“Actual”) and the sampled standard deviation (“Projected”).
| mean |
$118,354 |
|
|
| stddev |
$16,343 |
|
|
|
|
|
|
| Percentile |
Actual |
Projected |
Delta |
| 75% |
$129,317 |
$129,377 |
60.19 |
| 90% |
$139,299 |
$139,298 |
0.60 |
| 99% |
NA |
$156,374 |
NA |
| 99.9% |
NA |
$168,858 |
NA |
| 99.99% |
NA |
$179,134 |
NA |
Software Engineering Salary
Below is the
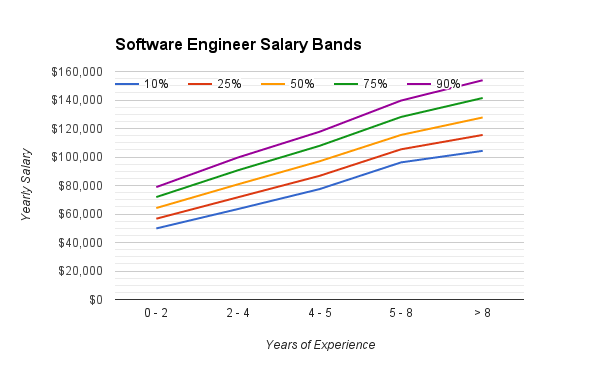
Salary.com salary data for Software Engineers. The available salary percentile data has been plotted for individuals with varying levels of experience.
| Software Engineer |
Percentile |
|
| Experience (yrs) |
10% |
25% |
50% |
75% |
90% |
Source |
| 0 – 2 |
$49,862 |
$56,690 |
$64,190 |
$71,879 |
$78,879 |
http://swz.salary.com/SalaryWizard/Software-Engineer-I-Salary-Details-Location.aspx |
| 2 – 4 |
$63,466 |
$71,732 |
$80,810 |
$90,668 |
$99,643 |
http://swz.salary.com/SalaryWizard/Software-Engineer-II-Salary-Details-Location.aspx |
| 4 – 5 |
$77,453 |
$86,760 |
$96,983 |
$107,826 |
$117,699 |
http://swz.salary.com/SalaryWizard/Software-Engineer-III-Salary-Details-Location.aspx |
| 5 – 8 |
$96,220 |
$105,405 |
$115,493 |
$128,115 |
$139,607 |
http://swz.salary.com/SalaryWizard/Software-Engineer-IV-Salary-Details-Location.aspx |
| > 8 |
$104,308 |
$115,475 |
$127,740 |
$141,406 |
$153,849 |
http://swz.salary.com/SalaryWizard/Software-Engineer-V-Salary-Details-Location.aspx |
Software Engineering Salary (for Experienced Top Performers)
The following data is representative of the interpolation that went into determining the 99, 99.9, and 99.99 percentile salaries. Using the 50th percentile salary reported by
Salary.com as the mean and assuming a normal distribution, the standard deviation of the data was determined (to the nearest dollar) as the value that resulted in the smallest delta between the data reported by
Salary.com (“Actual”) and the sampled standard deviation (“Projected”).
| mean |
$127,740 |
|
|
| stddev |
$20,373 |
|
|
|
|
|
|
| Percentile |
Actual |
Projected |
Delta |
| 75% |
$141,406 |
$141,481 |
75.38 |
| 90% |
$153,849 |
$153,849 |
0.05 |
| 99% |
NA |
$175,135 |
NA |
| 99.9% |
NA |
$190,697 |
NA |
| 99.99% |
NA |
$203,508 |
NA |
Systems Engineering Salary
Below is the
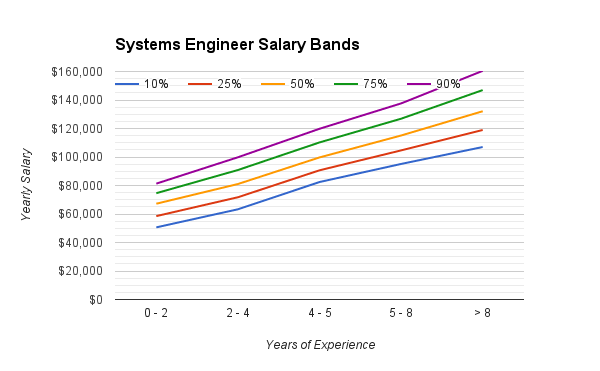
Salary.com salary data for Systems Engineers. The available salary percentile data has been plotted for individuals with varying levels of experience.
| Systems Engineer |
Percentile |
|
| Experience (yrs) |
10% |
25% |
50% |
75% |
90% |
Source |
| 0 – 2 |
$50,616 |
$58,526 |
$67,213 |
$74,591 |
$81,308 |
http://swz.salary.com/SalaryWizard/Systems-Engineer-I-Salary-Details-Location.aspx |
| 2 – 4 |
$63,299 |
$71,748 |
$81,029 |
$90,857 |
$99,805 |
http://swz.salary.com/SalaryWizard/Systems-Engineer-II-Salary-Details-Location.aspx |
| 4 – 5 |
$82,429 |
$90,657 |
$99,695 |
$110,219 |
$119,800 |
http://swz.salary.com/SalaryWizard/Systems-Engineer-III-Salary-Details-Location.aspx |
| 5 – 8 |
$95,118 |
$104,630 |
$115,079 |
$126,869 |
$137,604 |
http://swz.salary.com/SalaryWizard/Systems-Engineer-IV-Salary-Details-Location.aspx |
| > 8 |
$107,001 |
$118,969 |
$132,113 |
$146,951 |
$160,461 |
http://swz.salary.com/SalaryWizard/Systems-Engineer-V-Salary-Details-Location.aspx |
Systems Engineering Salary (for Experienced Top Performers)
The following data is representative of the interpolation that went into determining the 99, 99.9, and 99.99 percentile salaries. Using the 50th percentile salary reported by
Salary.com as the mean and assuming a normal distribution, the standard deviation of the data was determined (to the nearest dollar) as the value that resulted in the smallest delta between the data reported by
Salary.com (“Actual”) and the sampled standard deviation (“Projected”).
| mean |
$132,113 |
|
|
| stddev |
$22,120 |
|
|
|
|
|
|
| Percentile |
Actual |
Projected |
Delta |
| 75% |
$146,951 |
$147,033 |
81.71 |
| 90% |
$160,461 |
$160,461 |
0.08 |
| 99% |
NA |
$183,572 |
NA |
| 99.9% |
NA |
$200,469 |
NA |
| 99.99% |
NA |
$214,378 |
NA |
Telecommunications Engineering Salary
Below is the
Salary.com salary data for Telecommunications Engineers. The available salary percentile data has been plotted for individuals with varying levels of experience.
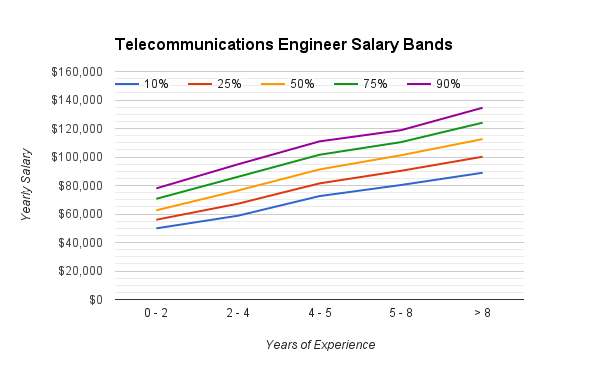
| Telecommunications Engineer |
Percentile |
|
| Experience (yrs) |
10% |
25% |
50% |
75% |
90% |
Source |
| 0 – 2 |
$49,928 |
$55,959 |
$62,584 |
$70,645 |
$77,984 |
http://swz.salary.com/SalaryWizard/Telecommunications-Engineer-I-Salary-Details.aspx |
| 2 – 4 |
$58,783 |
$67,206 |
$76,458 |
$86,088 |
$94,857 |
http://swz.salary.com/SalaryWizard/Telecommunications-Engineer-II-Salary-Details.aspx |
| 4 – 5 |
$72,565 |
$81,482 |
$91,275 |
$101,577 |
$110,956 |
http://swz.salary.com/SalaryWizard/Telecommunications-Engineer-III-Salary-Details.aspx |
| 5 – 8 |
$80,365 |
$90,314 |
$101,242 |
$110,443 |
$118,820 |
http://swz.salary.com/SalaryWizard/Telecommunications-Engineer-IV-Salary-Details.aspx |
| > 8 |
$88,942 |
$100,203 |
$112,571 |
$124,088 |
$134,575 |
http://swz.salary.com/SalaryWizard/Telecommunications-Engineer-V-Salary-Details.aspx |
Telecommunications Engineering Salary (for Experienced Top Performers)
The following data is representative of the interpolation that went into determining the 99, 99.9, and 99.99 percentile salaries. Using the 50th percentile salary reported by
Salary.com as the mean and assuming a normal distribution, the standard deviation of the data was determined (to the nearest dollar) as the value that resulted in the smallest delta between the data reported by
Salary.com (“Actual”) and the sampled standard deviation (“Projected”).
| mean |
$112,571 |
|
|
| stddev |
$17,169 |
|
|
|
|
|
|
| Percentile |
Actual |
Projected |
Delta |
| 75% |
$124,088 |
$124,151 |
63.31 |
| 90% |
$134,575 |
$134,574 |
1.04 |
| 99% |
NA |
$152,512 |
NA |
| 99.9% |
NA |
$165,627 |
NA |
| 99.99% |
NA |
$176,423 |
NA |
Test Engineering Salary
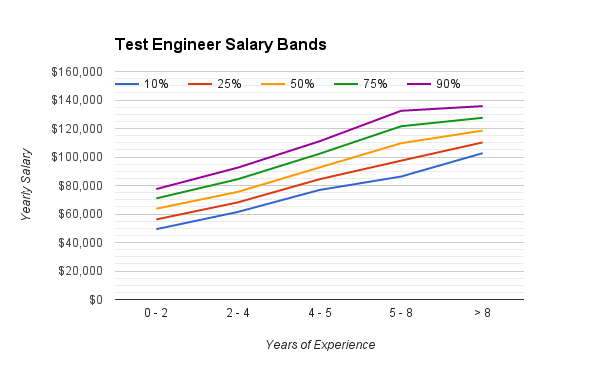
Below is the
Salary.com salary data for Test Engineers. The available salary percentile data has been plotted for individuals with varying levels of experience.
| Test Engineer |
Percentile |
|
| Experience (yrs) |
10% |
25% |
50% |
75% |
90% |
Source |
| 0 – 2 |
$49,345 |
$56,188 |
$63,705 |
$70,933 |
$77,513 |
http://swz.salary.com/SalaryWizard/Test-Engineer-I-Salary-Details.aspx |
| 2 – 4 |
$61,445 |
$68,166 |
$75,549 |
$84,450 |
$92,554 |
http://swz.salary.com/SalaryWizard/Test-Engineer-II-Salary-Details.aspx |
| 4 – 5 |
$76,863 |
$84,392 |
$92,661 |
$102,274 |
$111,027 |
http://swz.salary.com/SalaryWizard/Test-Engineer-III-Salary-Details.aspx |
| 5 – 8 |
$86,280 |
$97,427 |
$109,670 |
$121,572 |
$132,409 |
http://swz.salary.com/SalaryWizard/Test-Engineer-IV-Salary-Details.aspx |
| > 8 |
$102,702 |
$110,239 |
$118,517 |
$127,512 |
$135,702 |
http://swz.salary.com/SalaryWizard/Test-Engineer-V-Salary-Details.aspx |
Test Engineering Salary (for Experienced Top Performers)
The following data is representative of the interpolation that went into determining the 99, 99.9, and 99.99 percentile salaries. Using the 50th percentile salary reported by
Salary.com as the mean and assuming a normal distribution, the standard deviation of the data was determined (to the nearest dollar) as the value that resulted in the smallest delta between the data reported by
Salary.com (“Actual”) and the sampled standard deviation (“Projected”).
| mean |
$118,517 |
|
|
| stddev |
$13,409 |
|
|
|
|
|
|
| Percentile |
Actual |
Projected |
Delta |
| 75% |
$127,512 |
$127,561 |
49.23 |
| 90% |
$135,702 |
$135,701 |
0.68 |
| 99% |
NA |
$149,711 |
NA |
| 99.9% |
NA |
$159,954 |
NA |
| 99.99% |
NA |
$168,385 |
NA |


