As I begin to dip my toes into the blogging world, I wonder what success might look like and what techniques or best practices might be used to get there. I began to think of those blogs that I subscribe to and what insight I might be able to extract and derive from publicly available data. This immediately led me to ponder Pat Flynn at SmartPassiveIncome.com (SPI) as he routinely publishes his income reports. These income reports coupled with his publicly available RSS feed gave me some unique insight into the posting quantity & frequency, effectiveness of different media types (text, audio, video), and the monetary value of a world class blog like SPI.
I should mention that while I am a long time fan of his blog and podcast I am in no way affiliated with Pat Flynn at SmartPassiveIncome.com. As I derived the information that follows from publicly available data, my projections may not be fully representative of Pat Flynn’s actual business model. I’m include this disclaimer as its highly likely that Pat will stumble upon this post through his use of Google Alerts. Pat: Thank you for all your inspirational and insightful posts.
SPI RSS Feed Data Source
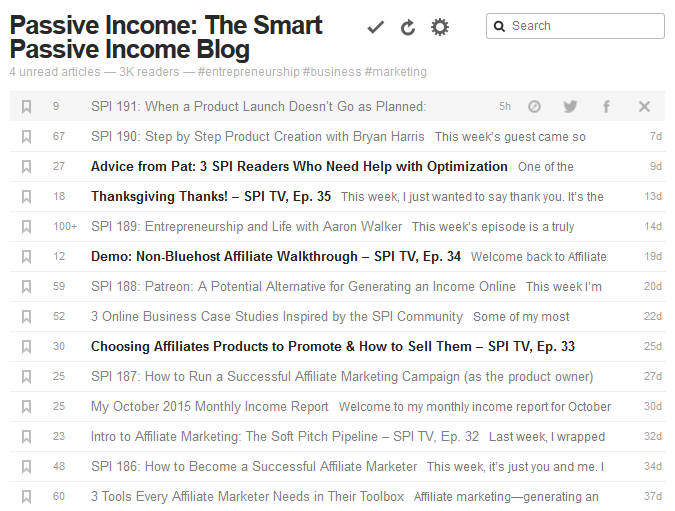 I routinely read SPI through a newsreader (i.e Feedly.com) as opposed to visiting Pat Flynn’s site directly. At the time I began drafting this post, I pulled 30 months of SPI feed information available within Feedly, 5/2/2013 though 12/9/2015. Feed data pulled includes a popularity score available within feedly, a link to SPI blog post, and when the post was made.
SPI Publishes Posts Frequently
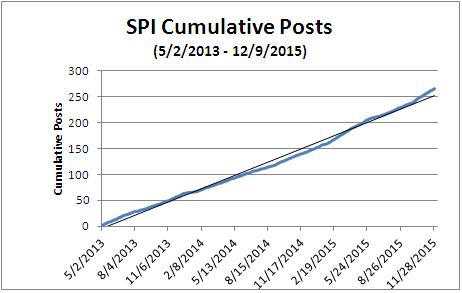 Based on the RSS feed data, SPI published 267 posts over the 30 month period. The figure shows the cumulative posts published during this period along with a linear trend line through the data points. As you can see, SPI has a very routine publishing schedule.
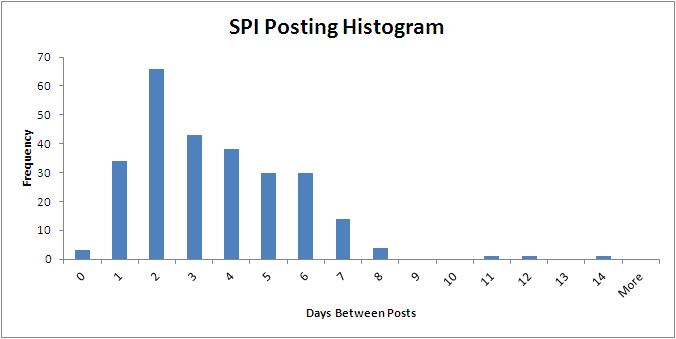 Based on the RSS feed data, SPI typically publishes at least once a week, but has been known to publish more than once a day. Given Pat Flynn’s posting schedule, SPI publishes every 3.56 days on average. The figure shows a histogram of the days between posts.
SPI Feedly Popularity Score for Various Post Types
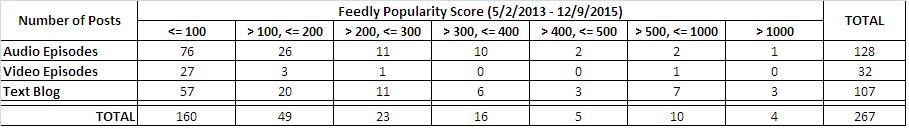
Pat Flynn publishes an assortment of blog post types in the form of a text blog, an audio podcast, and video episodes. The table displays the popularity score provided by the Feedly interface, binned by post type. In my breakdown, I noted that roughly half of all SPI Text Blog posts are SPI’s Income Reports and Nitch Site Duel updates. Half of all SPI Text Blog Posts contain recurring summary information of ongoing activities.
SPI Most Popular Content Type
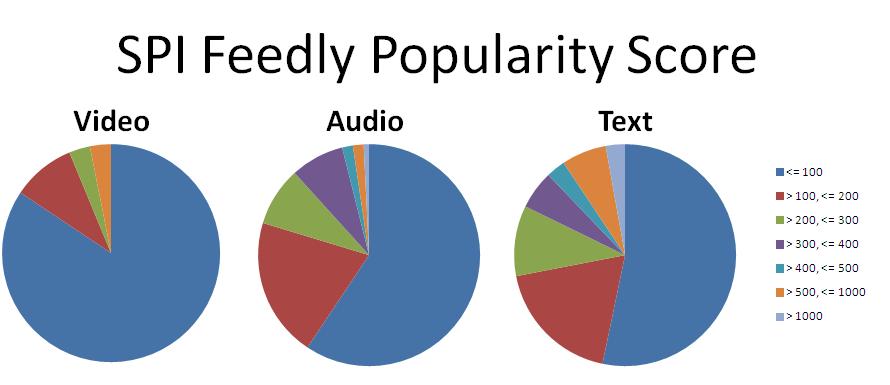
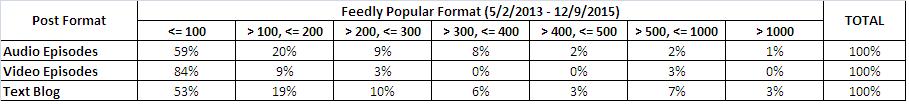
As i begin my blog, I take note of an ongoing trend of bloggers incorporating Audio Podcasts and Video posts into their feeds and i was concerned that a text based blog would not be enough to gain traction in today’s blogging world. However, based on the Feedly popularity scores for the various SPI posts, it would appear that the SPI Audio Podcast and Text Blog posts are more popular than Video. Only 16% of Video posts exceeded a Feedly Popularity score of >100, while 47% and 41% of all SPI Text Blog and Audio Podcast posts did so respectively. It would appear that a text based blog is still a very effective format and that moving towards audio podcasts and video posts may be a natural progression for bloggers.
I suspect that the reason text and audio appears to be more popular could be that people can listen to a podcast while doing other things (i.e. mowing the lawn) and can read a blog post when they should be doing other things (i.e. @ work).
When it comes to SPI TV, I’m much more selective and don’t watch all of the video episodes. I find that if I try to watch a video episode (i.e. SPI TV) on my phone I am unable to do anything else while its’ playing. I can not shut off the screen or go to another application without disrupting the video. This is a drain on my battery, my ability to multitask, and even my data plan. The only way to overcome this issue is to view it on a desktop / laptop computer, but I typically don’t want to spend any more time in front of the computer after work.
My one recommendation for Pat Flynn would be to refine how the SPI TV video format is being applied . Pat may want to consider transcribing or providing an audio only version of his SPI TV posts. Both approaches are not without their flaws, but it may aid in improving SPI TV’s popularity. There may be more difficulty in editing the transcriptions as the spoken word can be different than the written and there may be some issues with comprehension without the video content It’s also possible that this could be an education issue, in that I simply haven’t found or been directed to an efficient way of absorbing the SPI TV posts.
SPI Monthly Gross Income
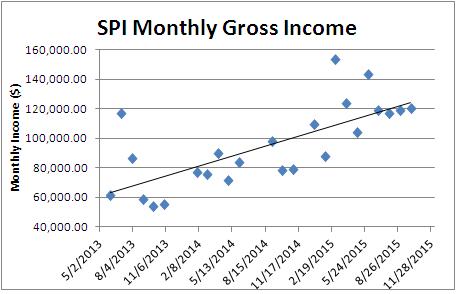 I downloaded the SPI Monthly Income Reports between 5/2/2013 and 12/9/2015 from Pat Flynn’s website and plotted the data over time along with a linear trend line. SPI experienced consistent growth and doubled it’s monthly gross income in the last 2.5 yrs. Most investments can’t deliver this growth rate.
In the OCT 2015 SPI Income Report, Pat Flynn stated that he has over 140,000 subscribers on his mailing list. This coupled with the fact that he made ~$120,000 in gross income in OCT 2015, one can conclude that SPI earns $0.86 per month in gross income for each of its subscribers on average ($120,000 monthly / 140,000 subscribers).
Based on the OCT 2015 SPI Income Report, SPI earned $120,217.71 in income for the month and incurred $33,238.32 in expenses. For every $1 of income earned on SPI, $0.28 (or 28%) is paid out as expenses ($33,238.32 / $120,217.71). It should be noted that this is a point estimate and may not reflect his actual expenditure for all months in the period.
Based on the projections, SPI nets a profit of $0.62 per subscriber per month ($0.86 gross profit *[1-28% expense]).
Assuming you can build a mailing list as effectively and efficiently as Pat Flynn and you can achieve similar conversions rates, you can begin to evaluate the income potential of blogging. If you have achieved this income and wanted to earn an additional $1,000 per month, then you may need as few as 1,613 subscribers ($1,000 / $0.62) to do so. Given the worldwide population of 3 billion internet users, you would only need to capture 0.000054% of the market (1,613 / 3,000,000,000). There seems to be plenty of room for growth in the blogging space as even SPI has only captured 0.0047% of internet users (3,000,000,000 / 140,000).
Although $0.62 per subscriber per month may be a good benchmark for net income, it does not give any insight into how much of that income is the result of his SPI email newsletter, search engine optimization (direct traffic), people that read his blog posts but do not subscribe to his email newsletter (i.e. through a newsreader like Feedly), or through which of his various sites his subscribers are coming from.
SPI Metrics from Alexa.com
Alexa.com estimates site traffic based on a sampling of millions of internet users that have installed their browser toolbar extension and / or directly through sites that have chosen to include their scripts on their web page.
At the time of this posting, the Alexa data for SPI shows:
- Global ranking of 11,328
- Top 5 visitor country of origin: – Don’t forget you are writing for a global market.
- 26% of visitors are from India
- 15% from the United States
- 4.5% from Brazil, South Africa, and Australia each
- 49.4% bounce rate
- 2.42 daily page views per visitor
- 2:57 daily duration on site per visitor
- 13.5% of visitors arrive at SPI through search engines
- Top 5 search engine keywords:
- 14.55% Pat Flynn
- 3.34% Passive Income
- 2.56% Affiliate Marketing
- 1.90% Smart Passive Income Podcast
- 1.82% Bluehost Affiliate
- Top 5 sites visited just prior to SPI:
- 21.6% google.com
- 3.2% facebook.com – Don’t leave your friends behind on social media
- 2.5% google.co.in
- 1.9% youtube.com
- 1.3% amazon.com
- 4,683 sites link to SPI
- now 4,684 thanks to mine 🙂
- A little more than 50% of visitors are men
- Majority of visits are initiated from home (as opposed to work or school)
This data is based on a small cross section of internet users and may not be fully representative of the SPI audience. Then again, I’m continually impressed at how accurately CNN predicts the county and state election results every 4 years through similar methods.
Summary
Below is a list of the key insights from this blog post:
Posting Schedule:
- SPI has a very routine publishing schedule
- SPI typically publishes at least once a week
- SPI publishes every 3.56 days on average
Post Types:
- A text based blog is still a very effective format
- SPI Audio Podcast and Text Blog posts are more popular than Video
- Half of all SPI Text Blog Posts contain recurring summary information of ongoing activities
Growth Potential & Income:
- SPI experienced consistent growth and doubled it’s monthly gross income in the last 2.5 yrs
- SPI nets a profit of $0.62 per subscriber per month
- SPI earns $0.86 per month in gross income for each of its subscribers on average
- For every $1 of income earned on SPI, $0.28 (or 28%) is paid out as expenses
- Plenty of room for growth in the blogging space
- SPI has only captured 0.0047% of internet users
- Don’t forget you are writing for a global market
- Don’t leave your friends behind on social media
Recommendation to Pat Flynn
- Refine how the SPI video format is being applied
Your Next Steps
First, don’t hesitate to sign up for web hosting and reserve your domain name (i.e. MikeStrejcek.com). I’m currently using IONOS Web Hosting and am very happy with it, but I’m strongly considering switching to Bluehost Web Hosting . or DreamHost Web Hosting At the time of this post, shared hosting from both providers is $7 – $8 per month for the basic package, $10 – $11 per month for the intermediate package, and I’ve seen specials as low as $0.99 / month for the first year. The shared hosting service from both providers even includes the registration of your first domain name.
Second, don’t wait 2 years (like I did) to install WordPress through the Web Host’s Control Panel. WordPress is free, installs in a few button clicks, and offers many powerful plugins (most are also free). Let WordPress handle the technical details while you focus on the content and its promotion.
______________________________________
[email-subscribers-form id=”1″]
______________________________________
WOW just what I was searching for. Came here by searching for blog
Way cool! Some extremely valid points! I appreciate you writing this post
plus the rest of the website is extremely good.
Excellent website. Lots of useful info here. I’m sending it to
some buddies ans also sharing in delicious. And of course, thanks in
your sweat!